In Grade 3, we have been developing survey questions and collecting data. This morning we took the data we collected and presented our findings in the form of bar graphs. Please enjoy some of our work and reflections:

“We discovered that in 3RB the most popular carnival food is cotton candy.”
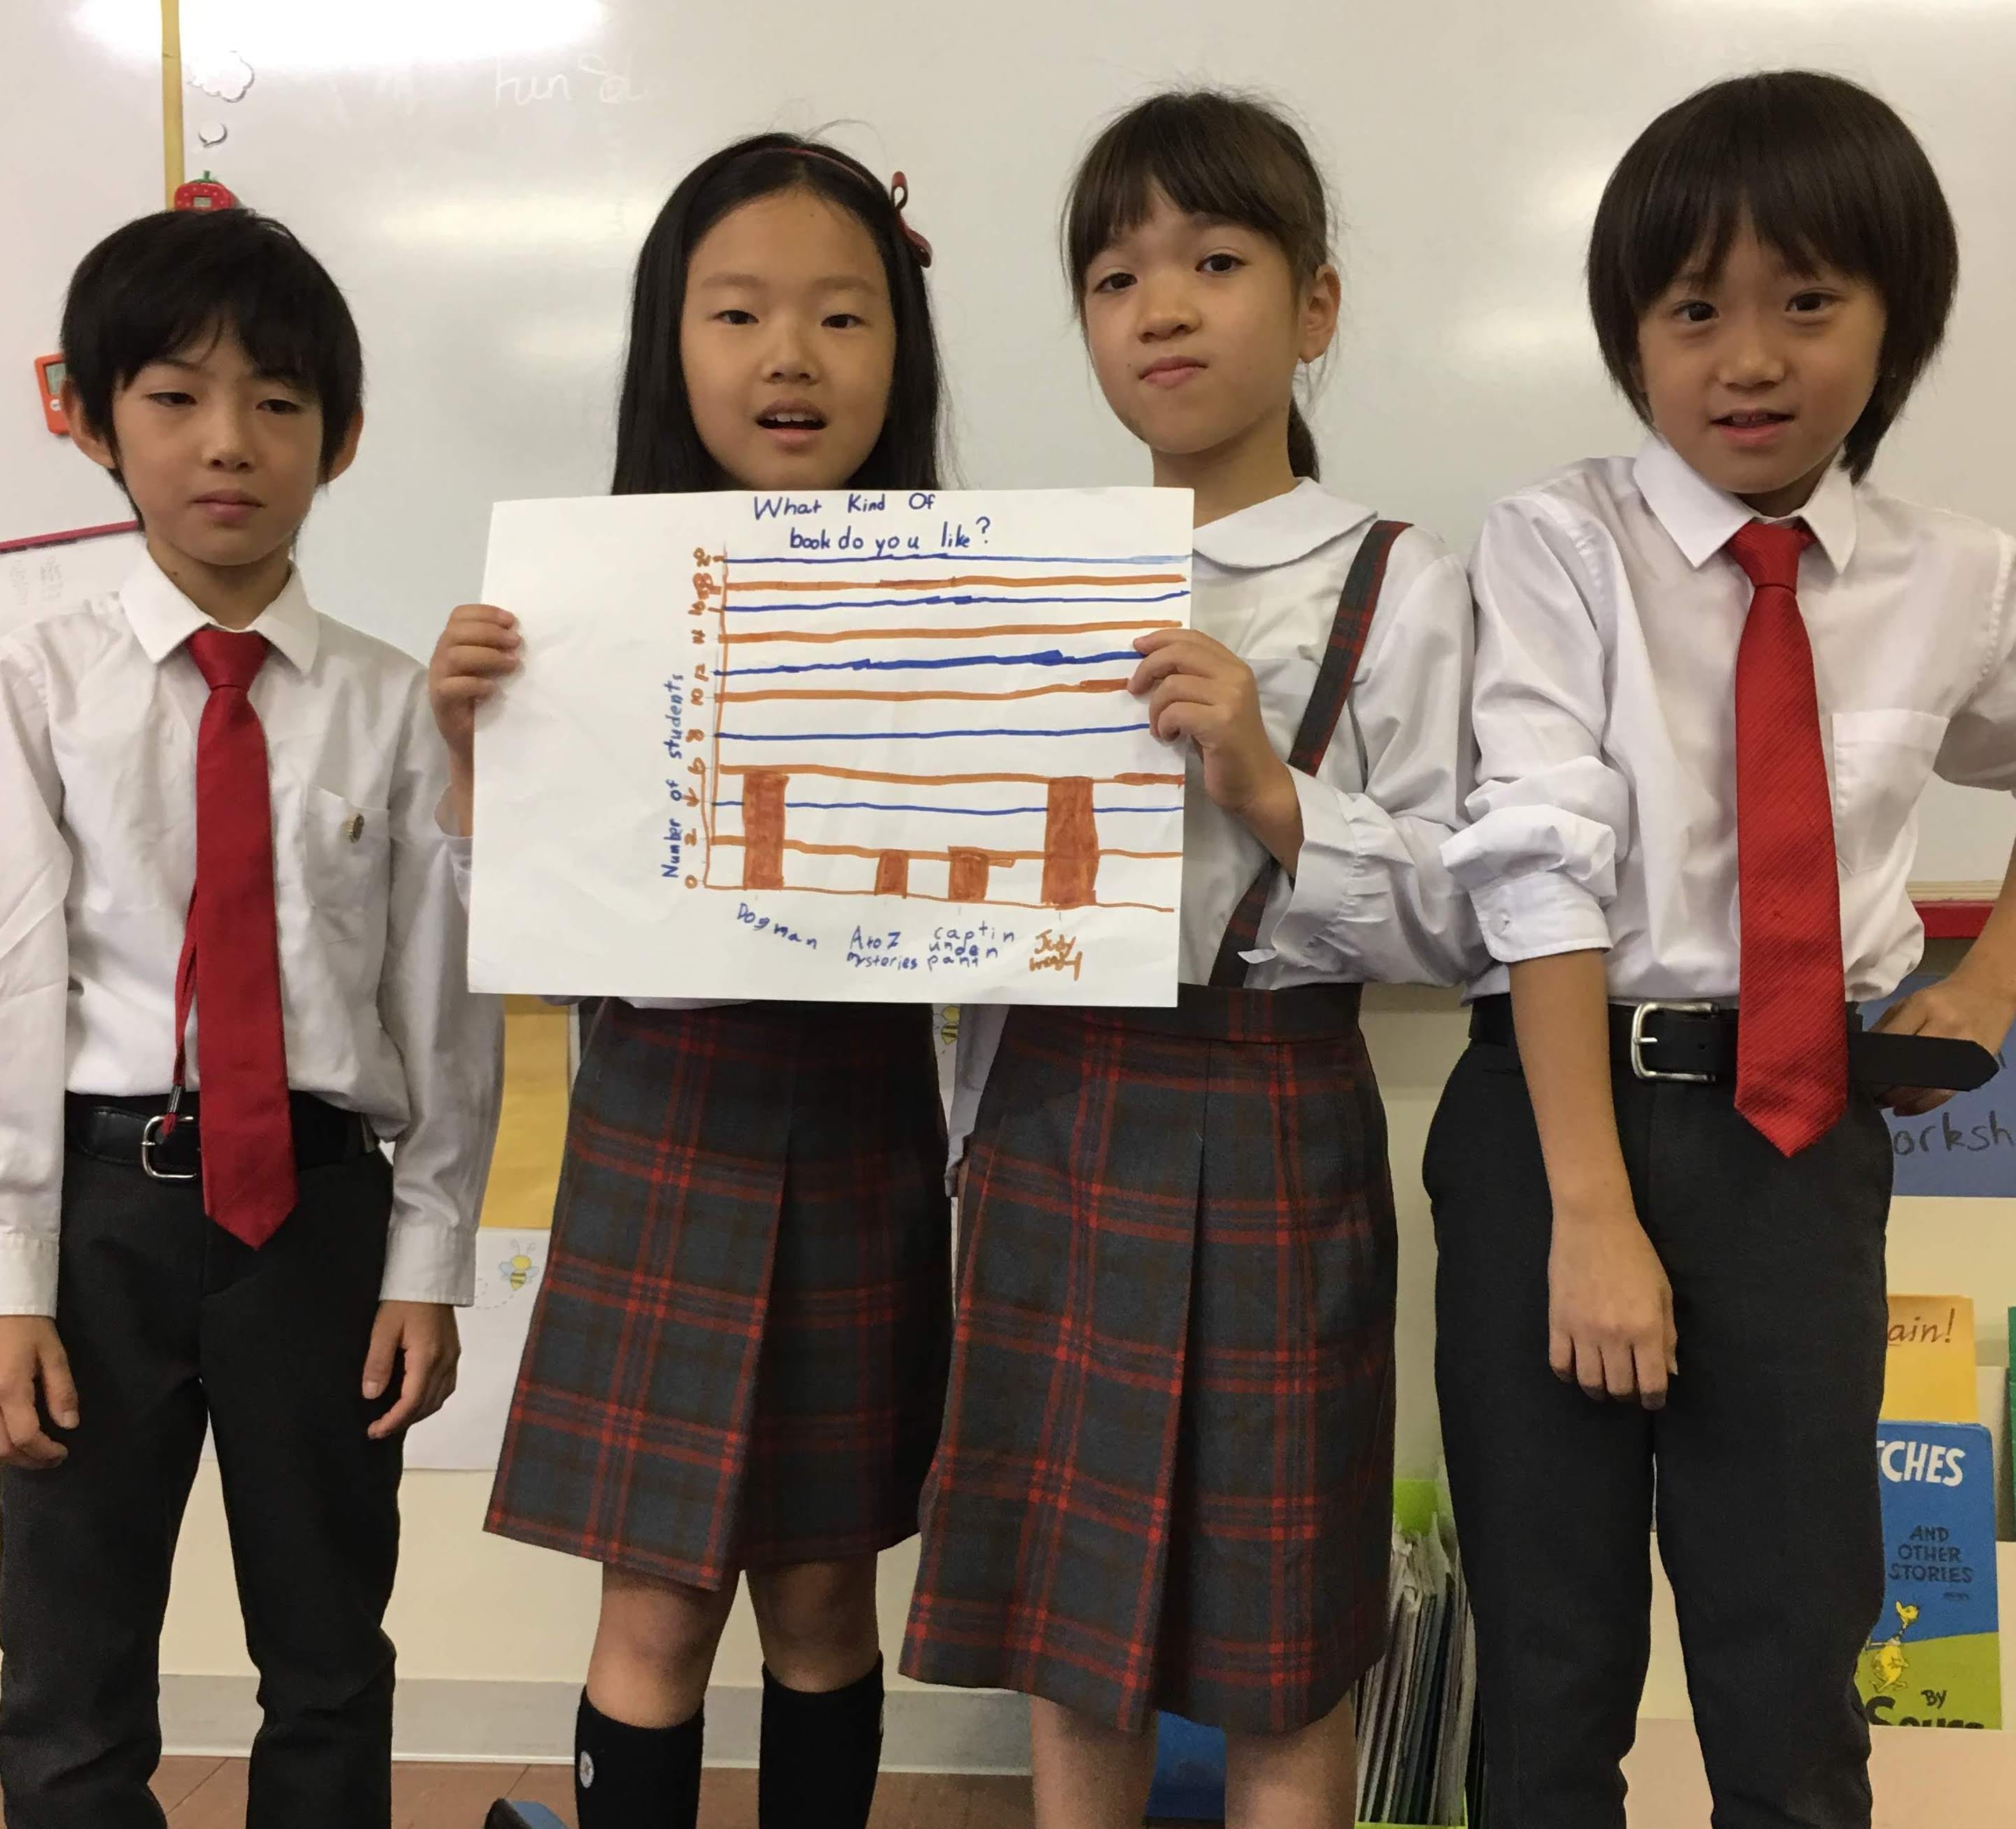
“We found out that more students in 3RB prefer to read Judy Moody and Dog Man.”
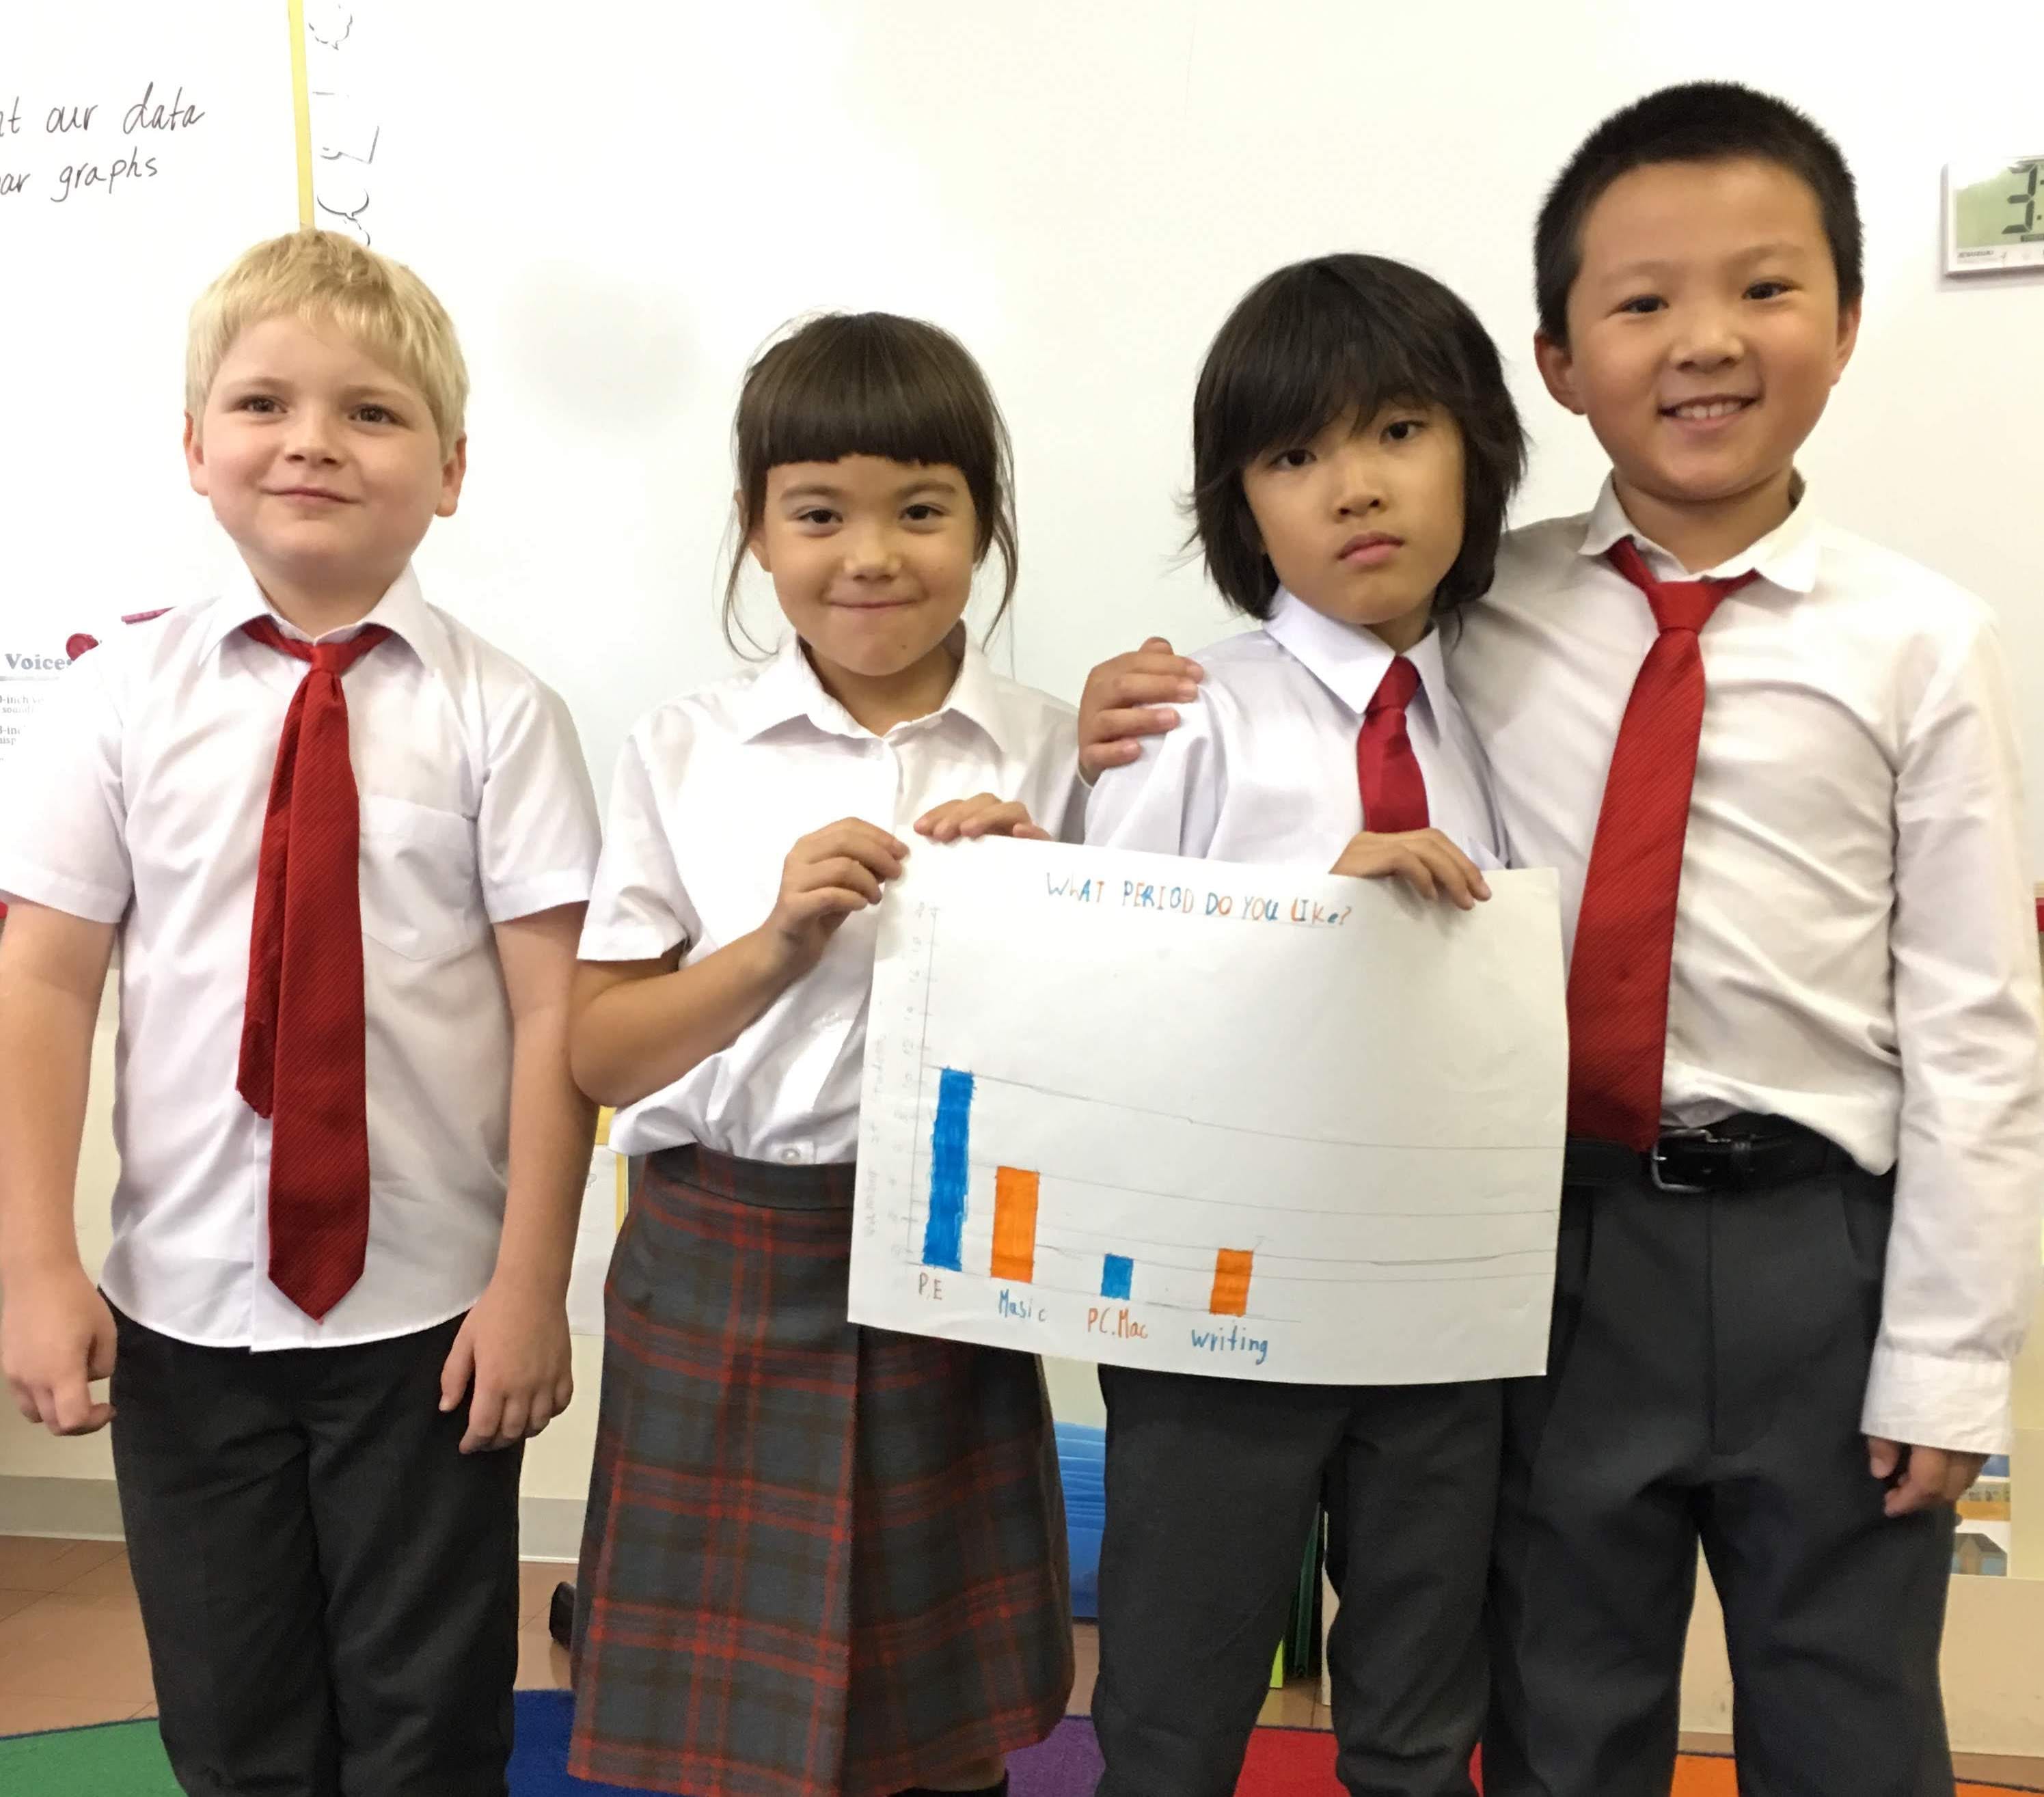
“We learned that in 3RB more students like P.E. than other subjects.”
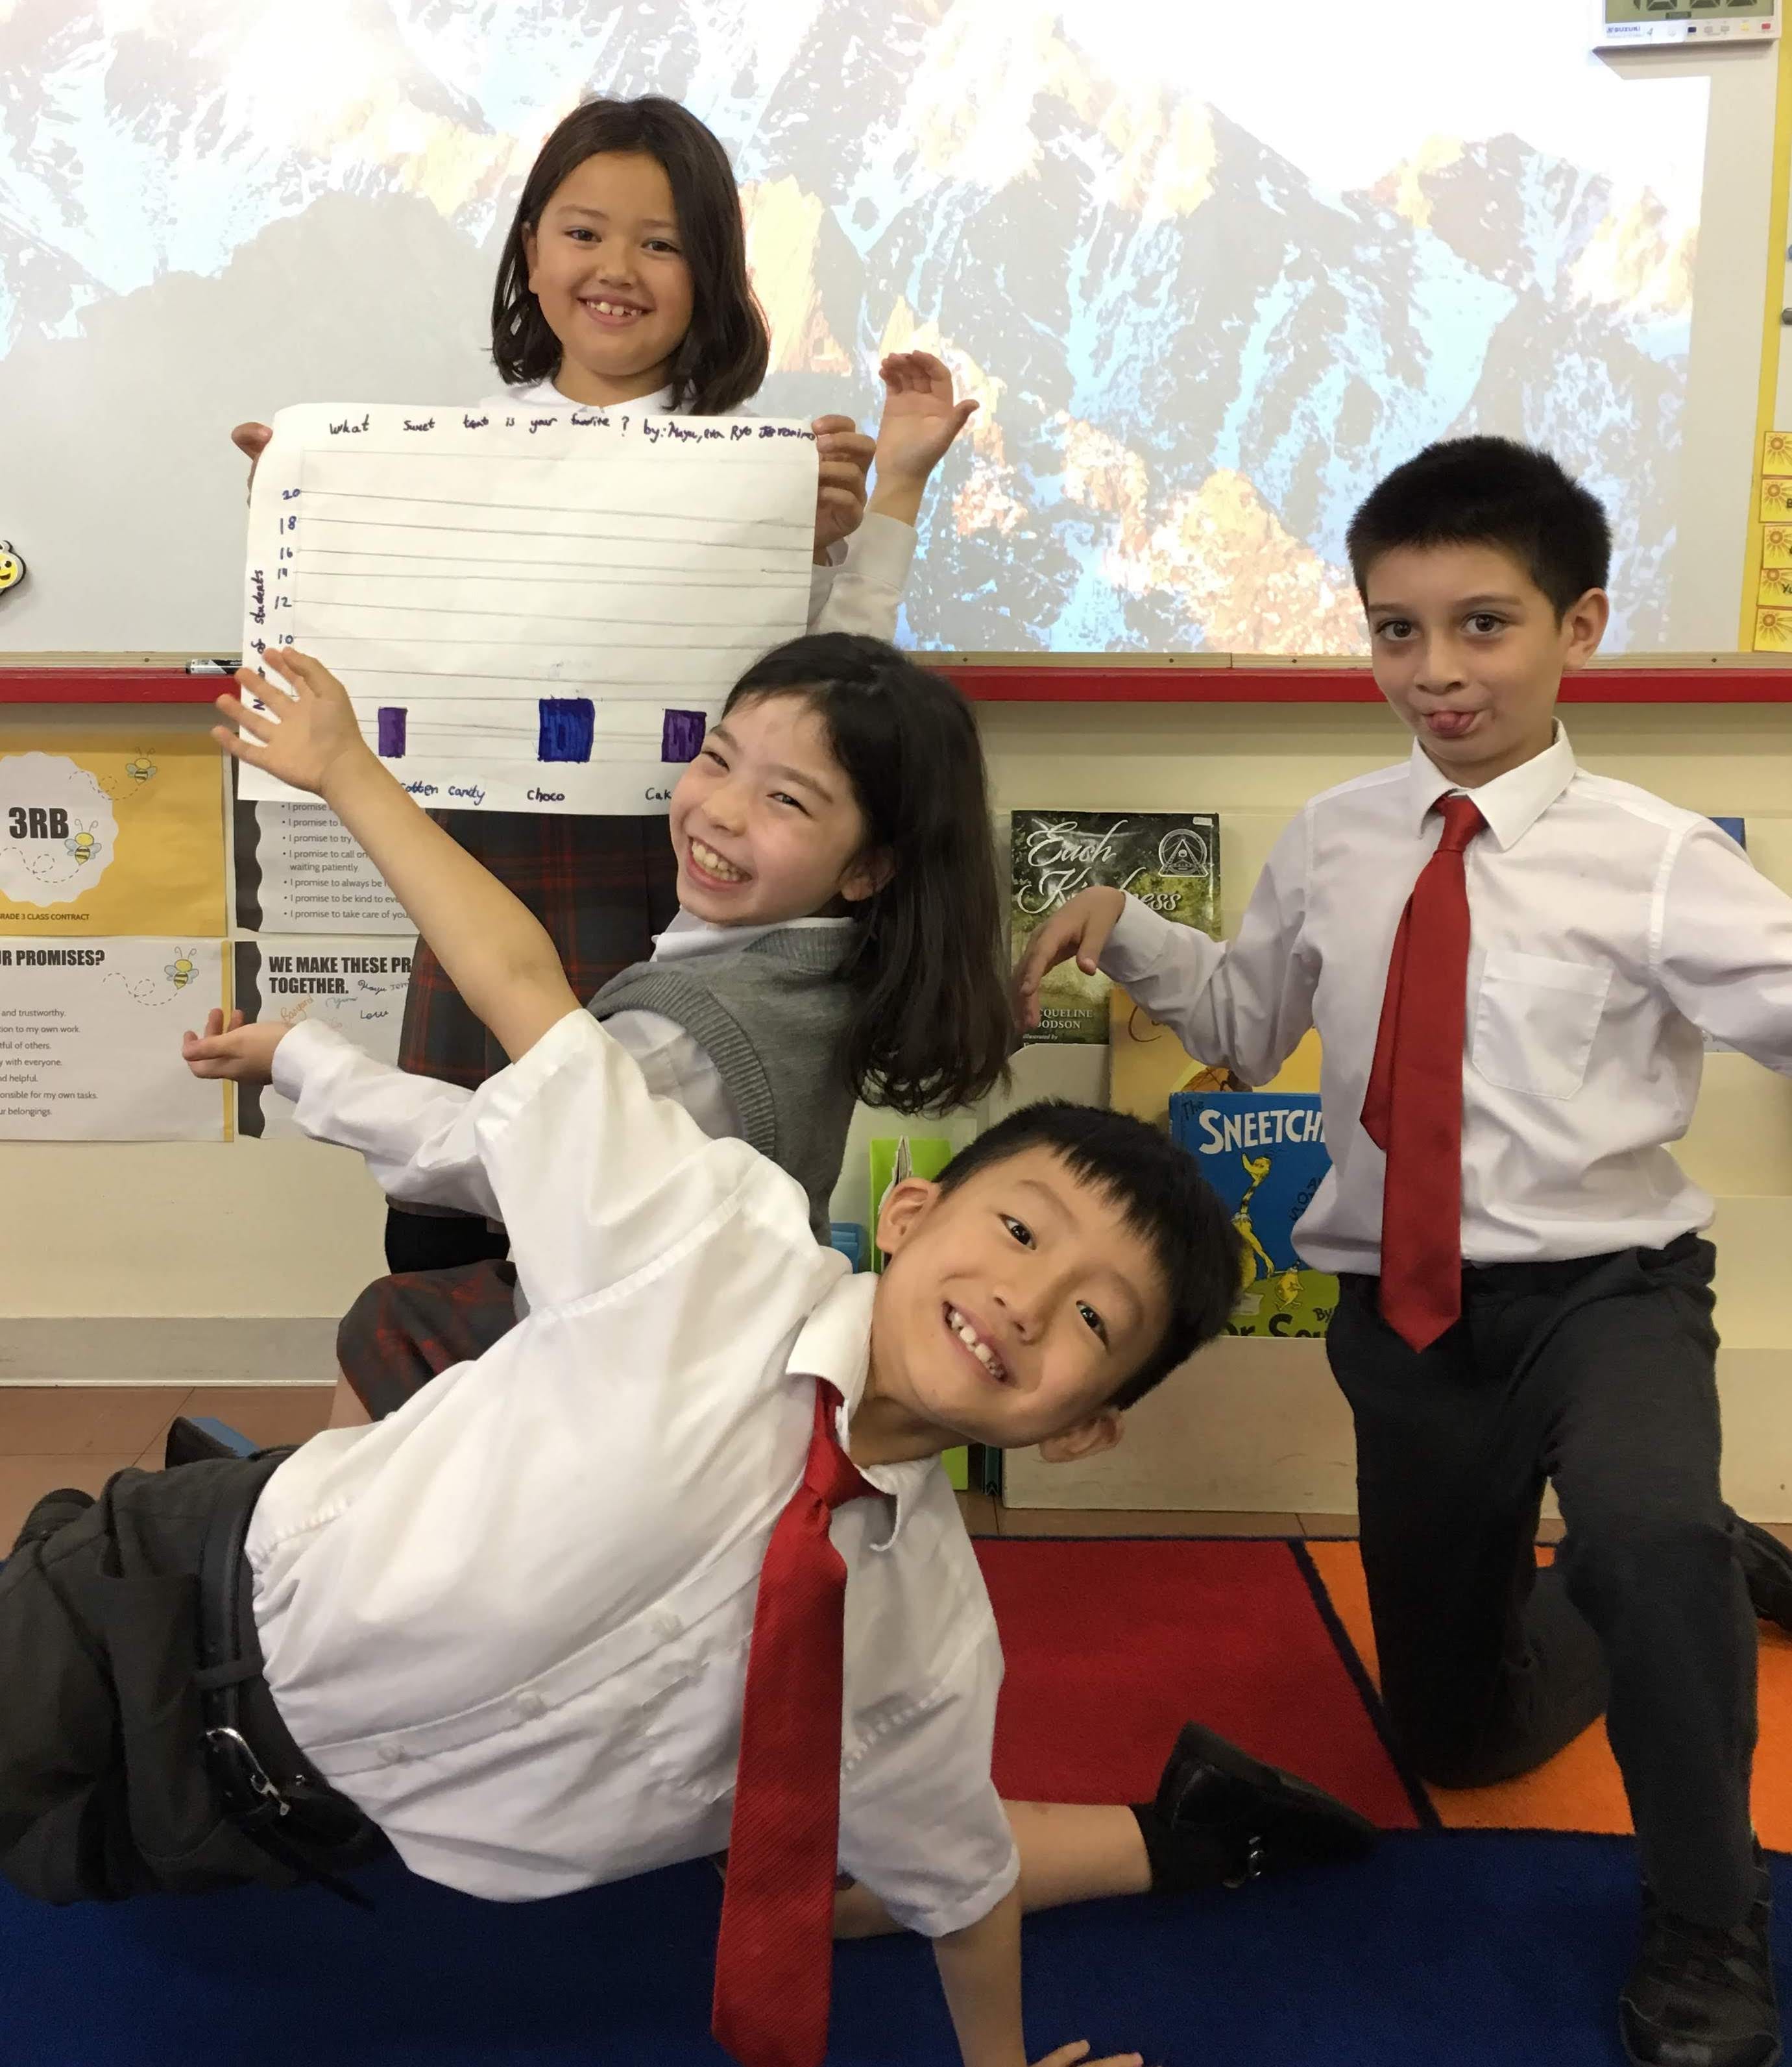
“We discovered that an equal amount of people like cotton candy and cake.”
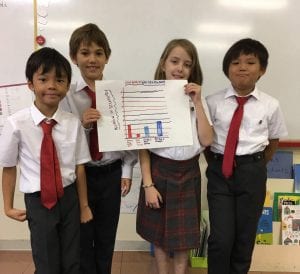
“Something that we see is that Robert Munsch books are a little more popular.”