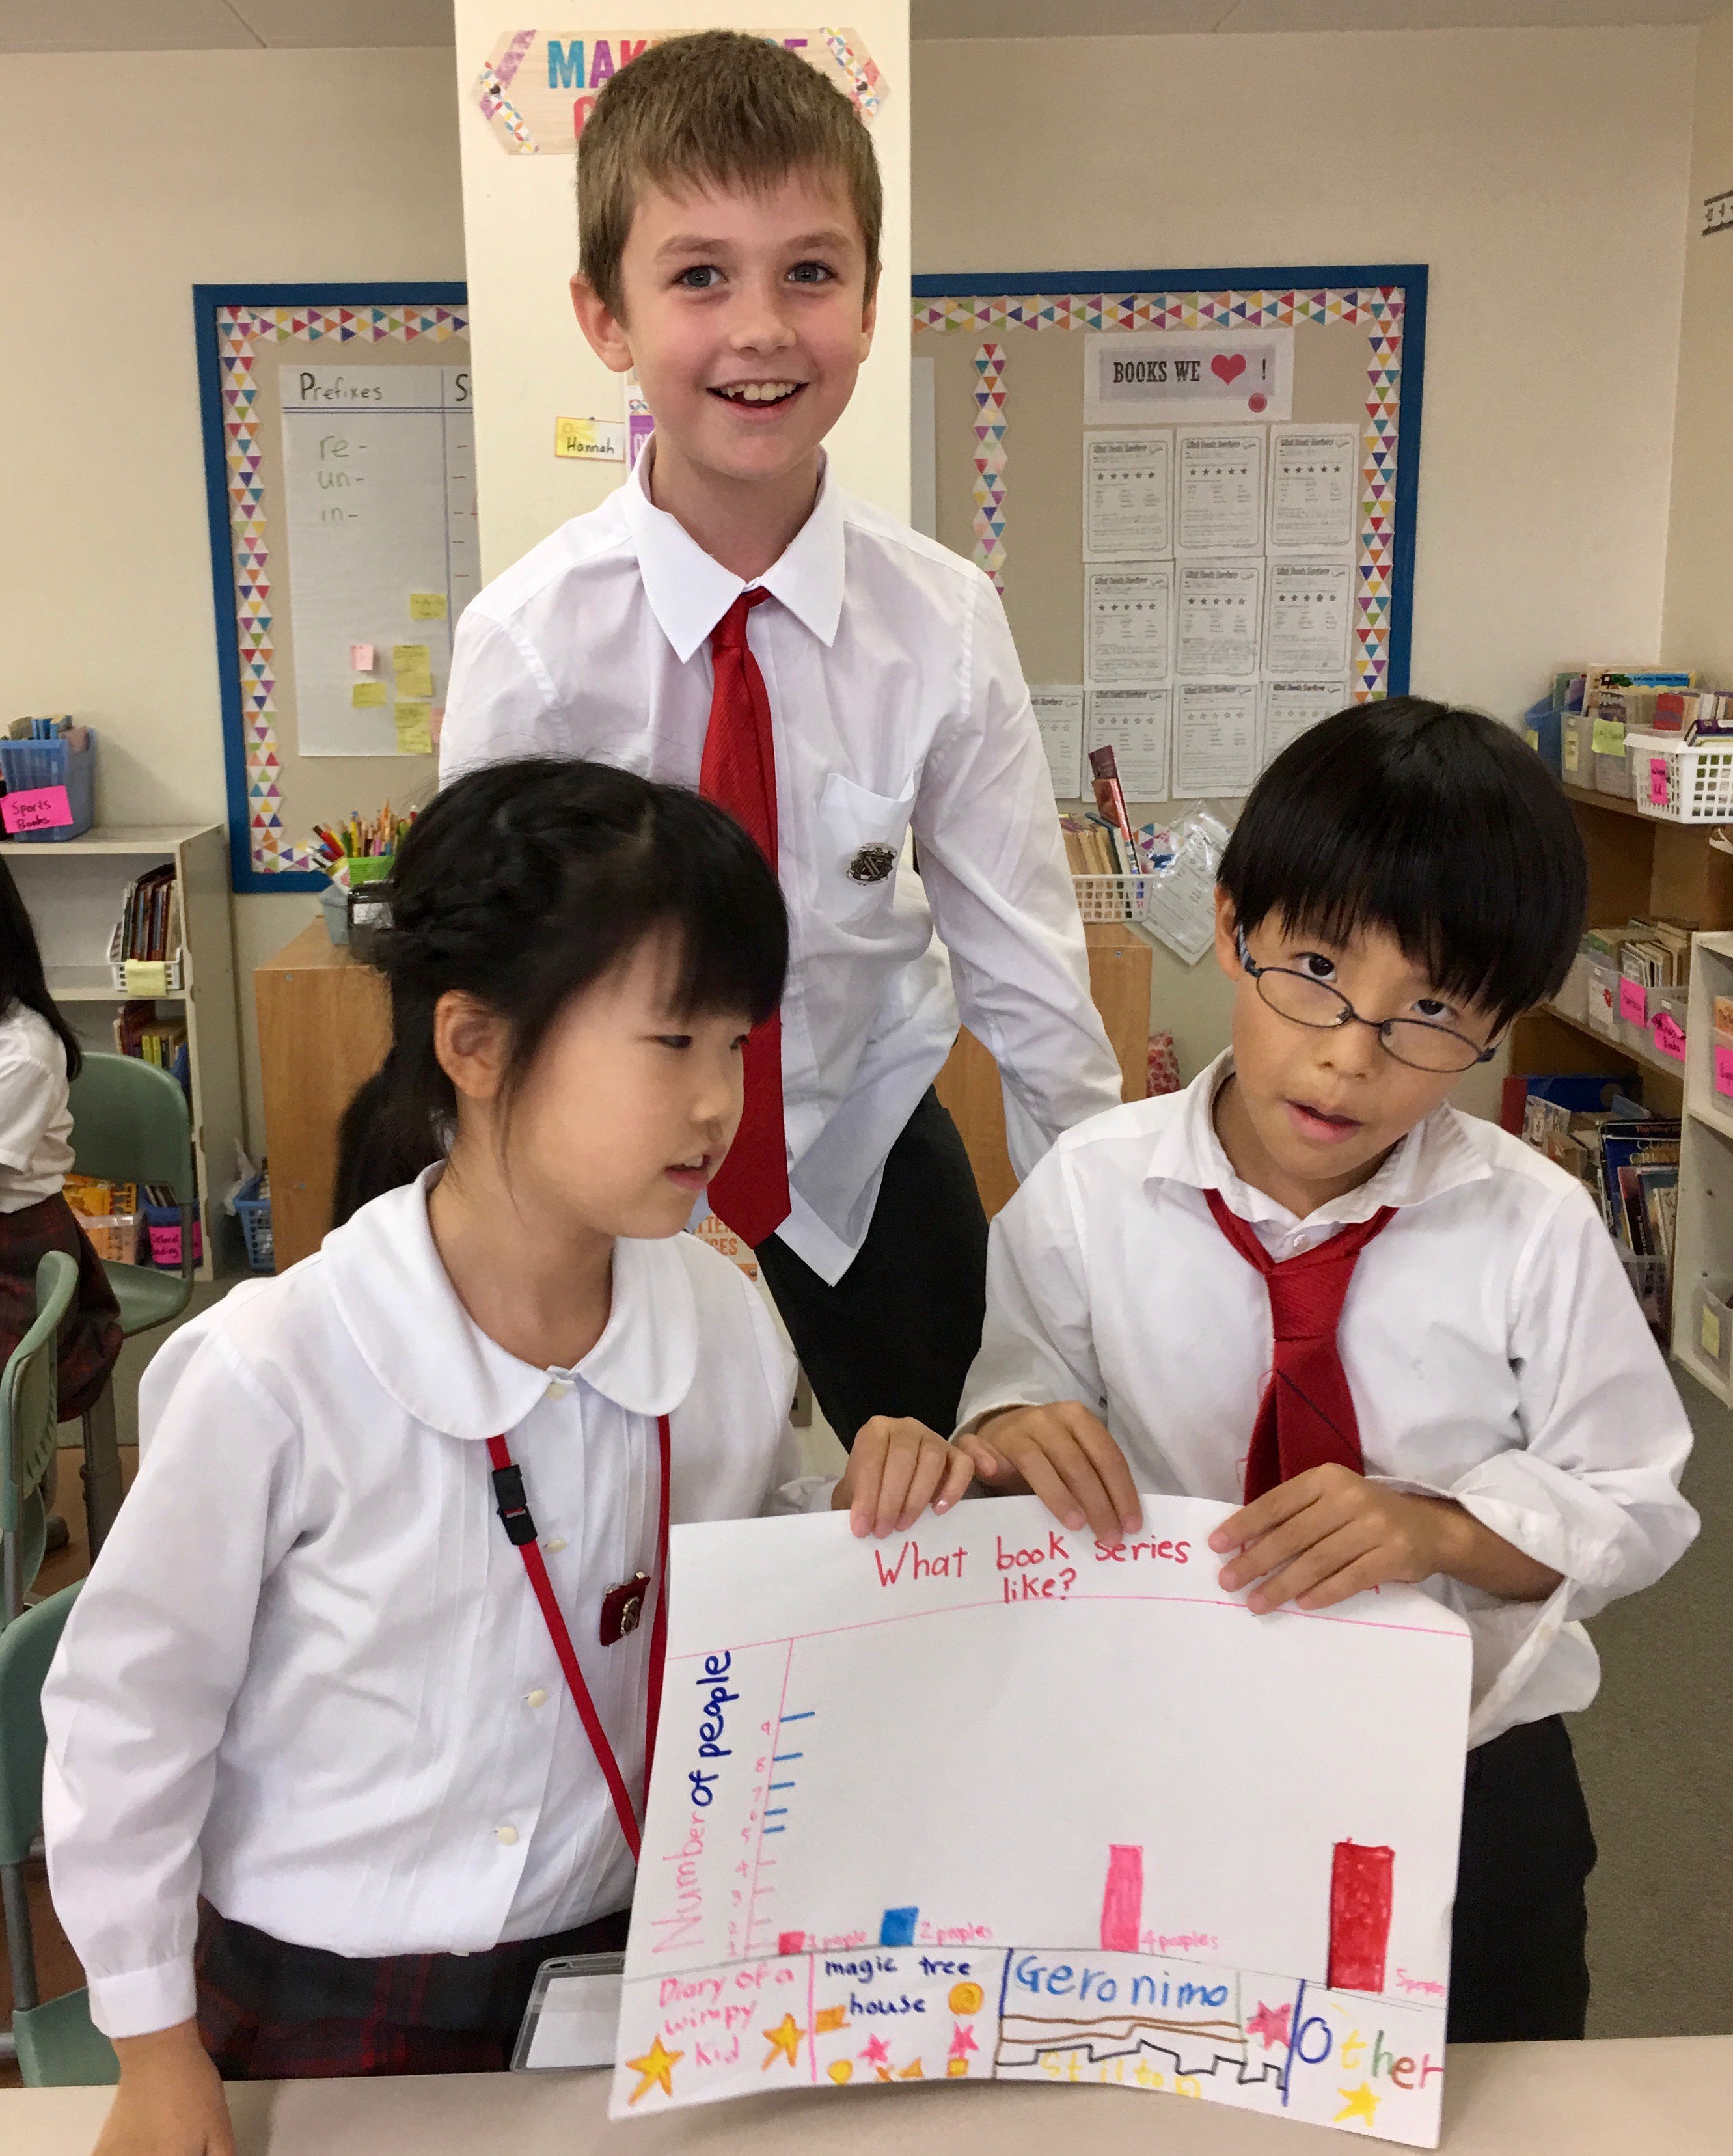
This week in 3B, groups of students developed a series of survey questions. They popped next door to visit our buddies in 3F and collect data. Some of these questions included:
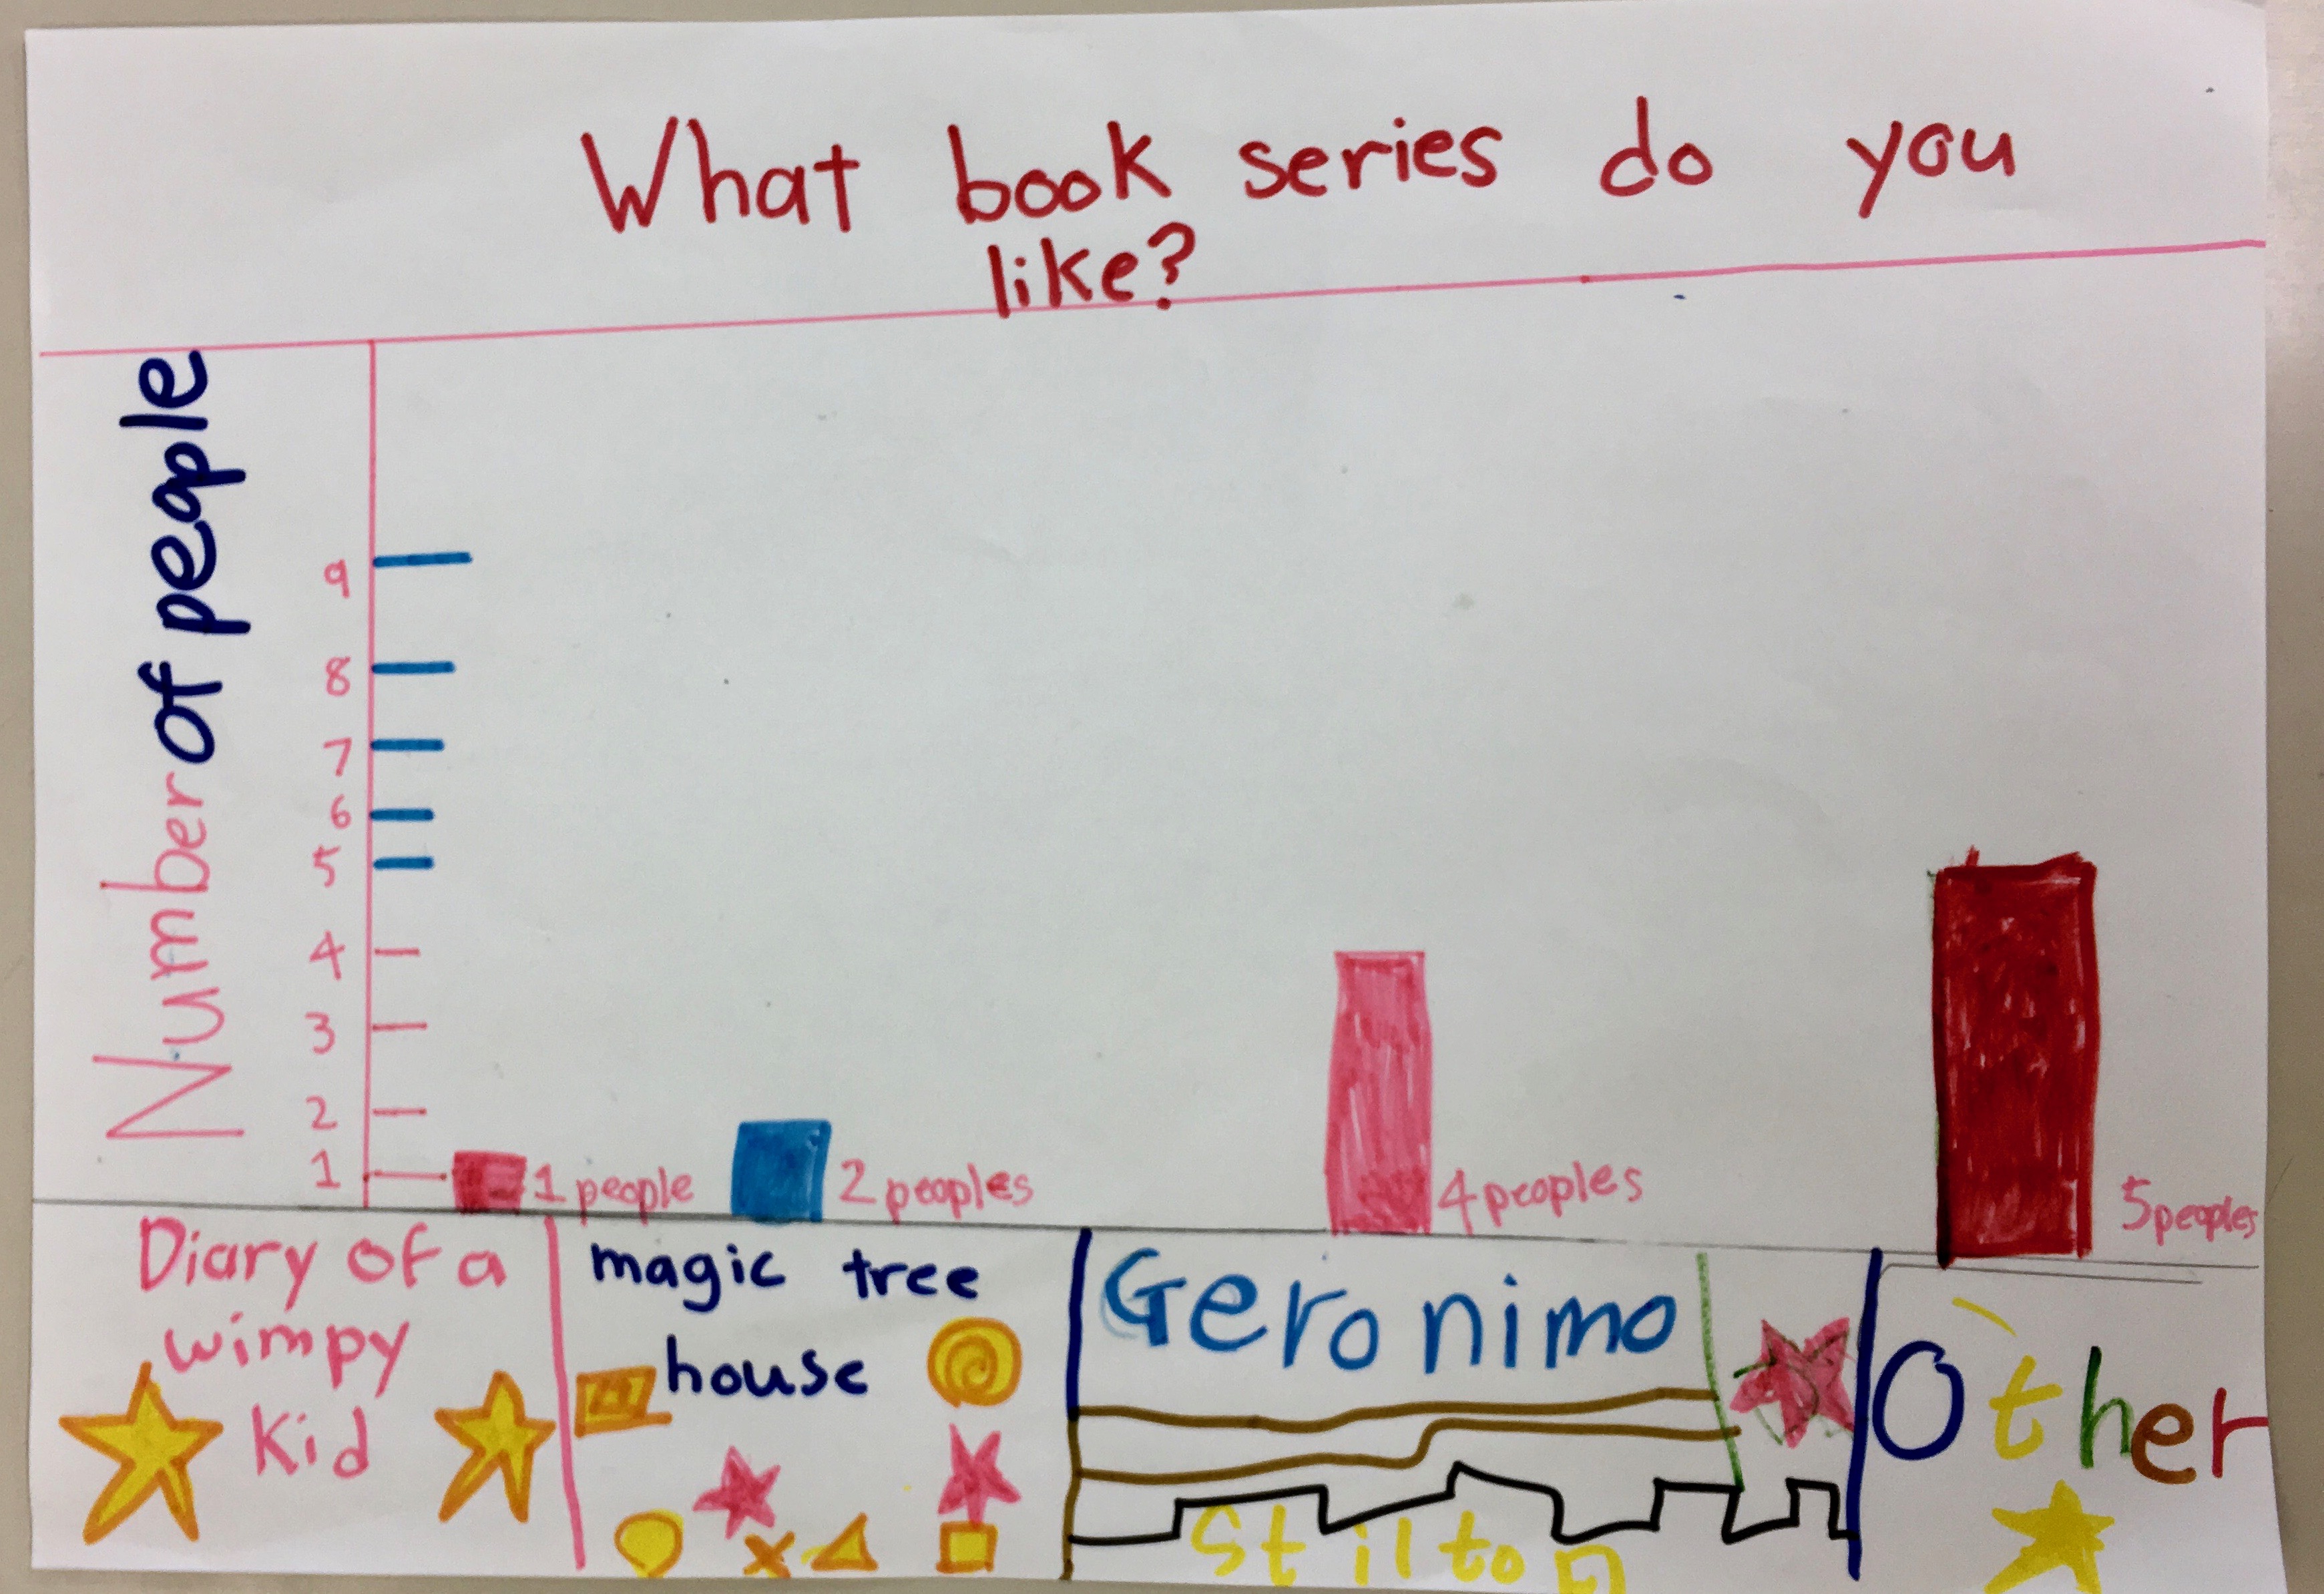
- What book series do you like?
- What is your favourite ice cream flavour?
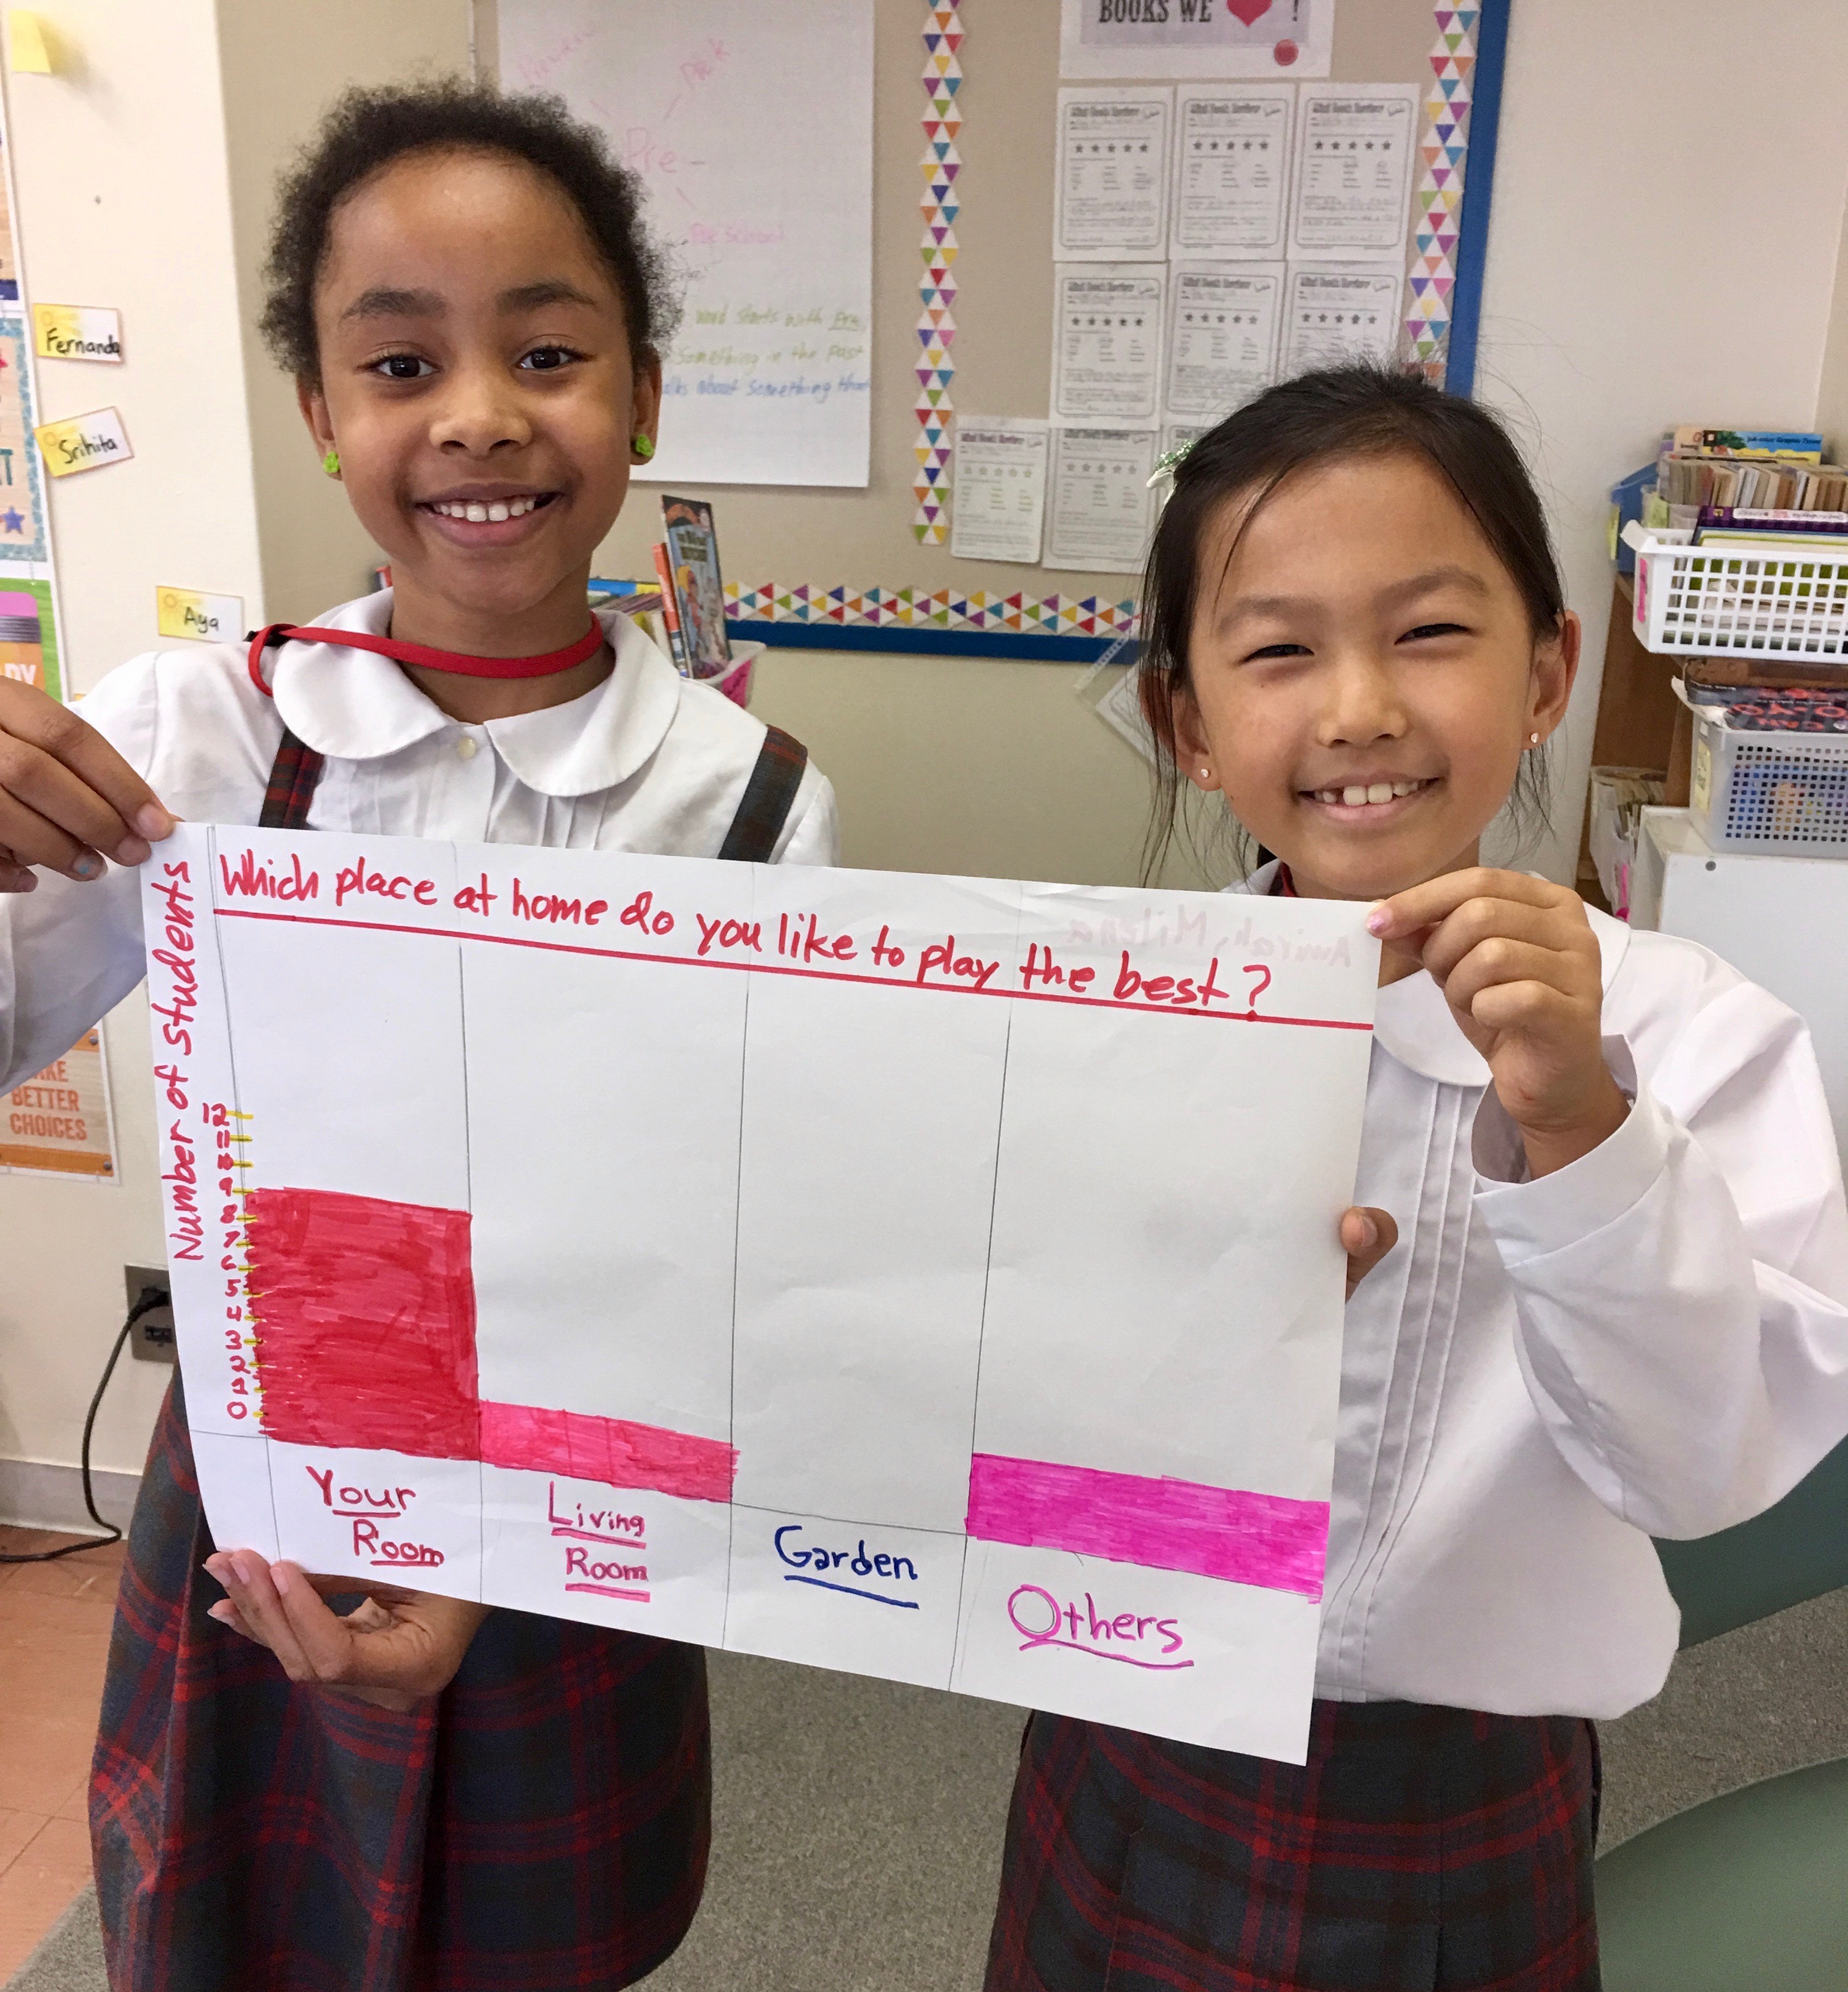
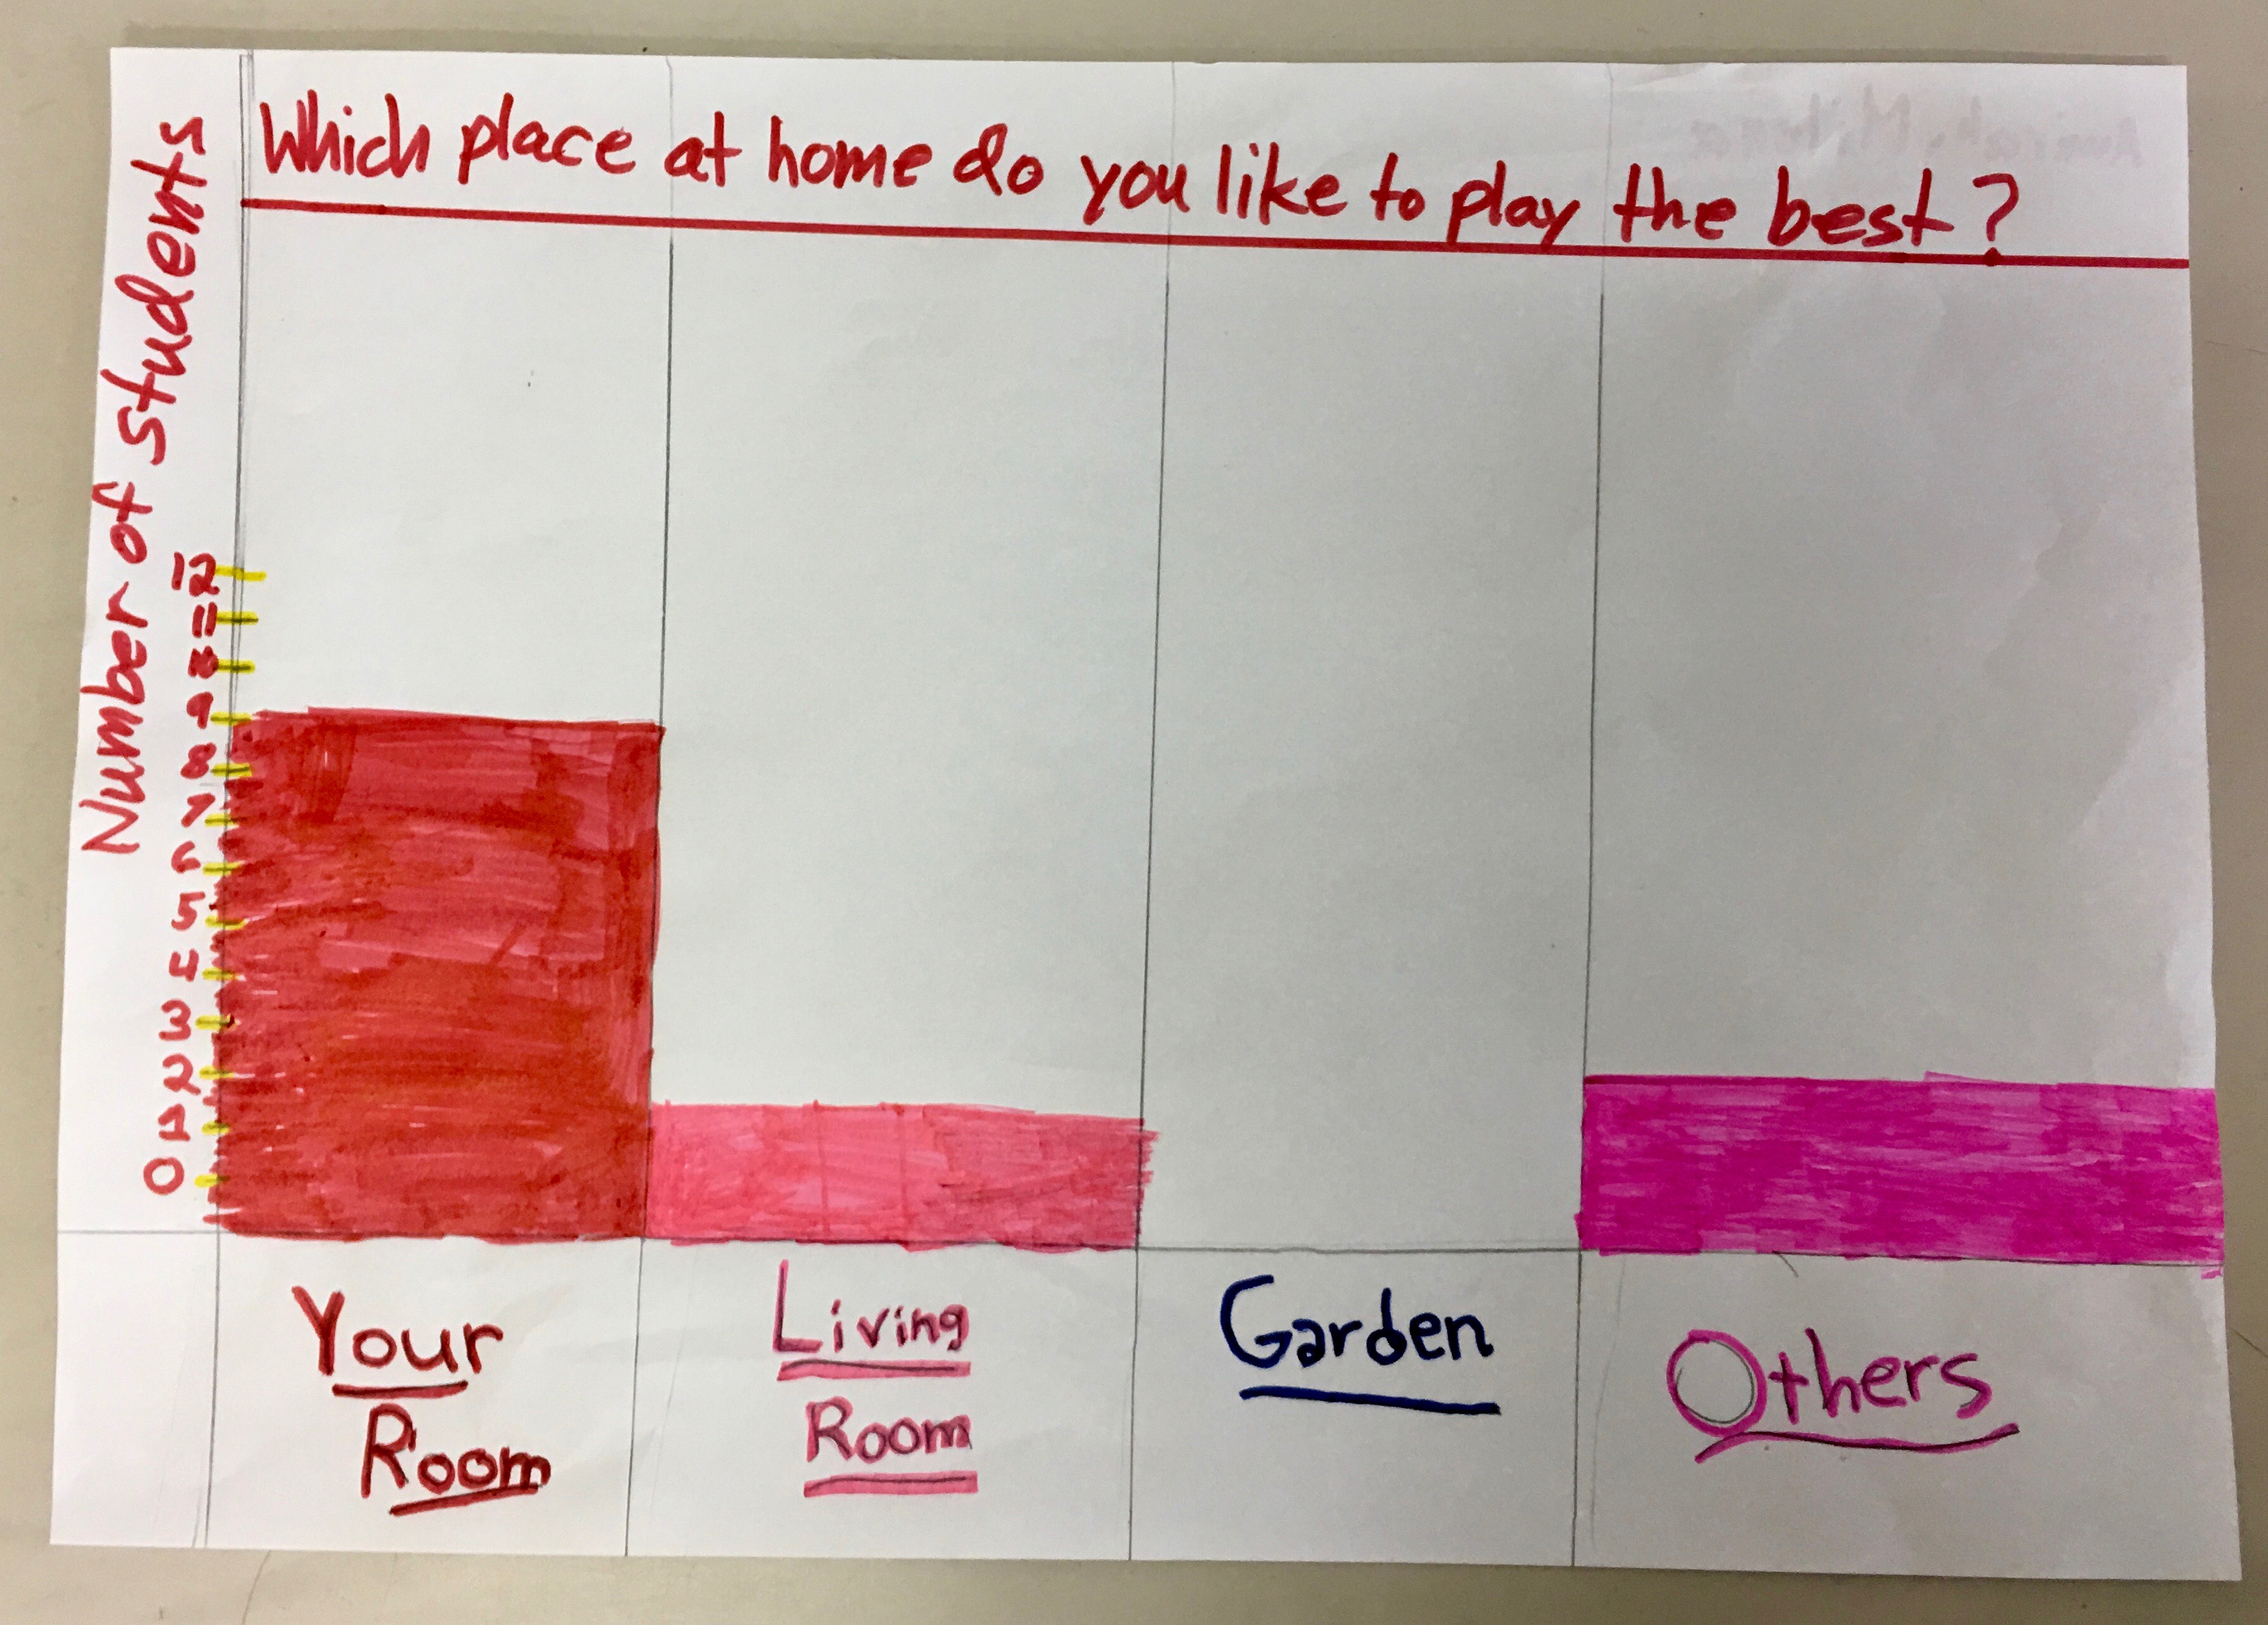
- What place at home do you like to play the best?

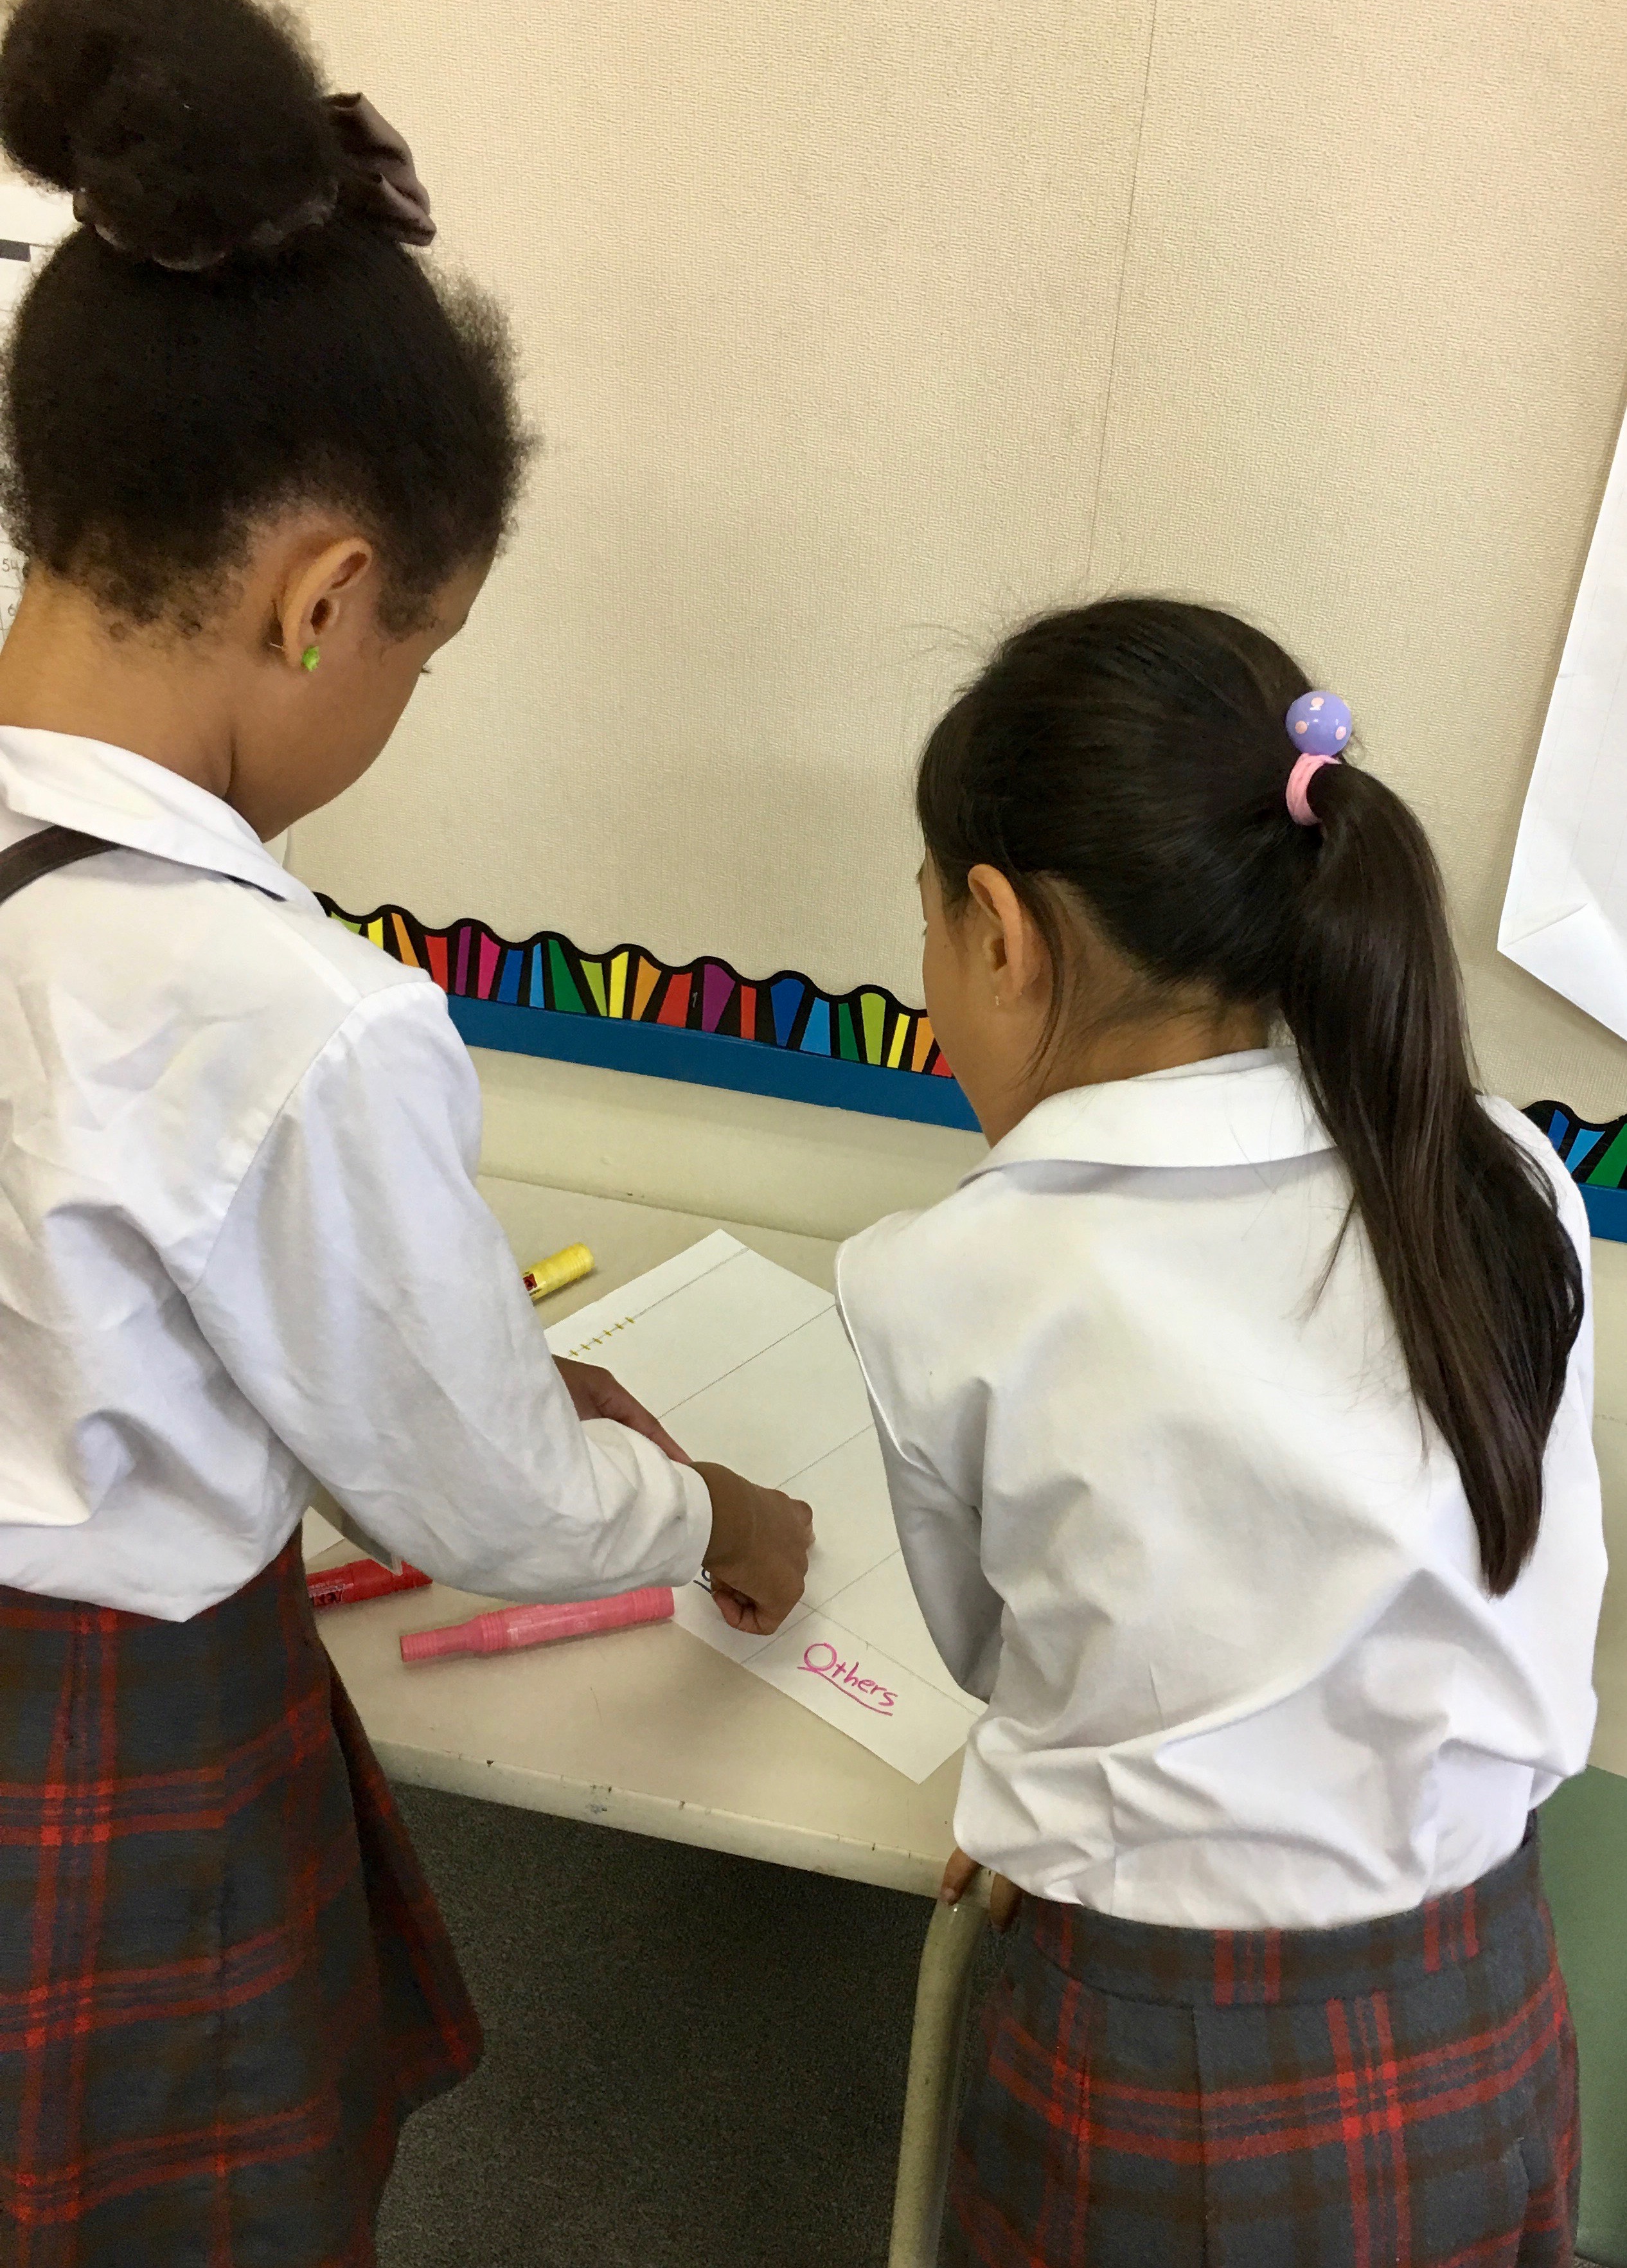
Once the data had been collected, the students were ready to create their own bar graphs to represent the data that they collected. Check out some of their fabulous bar graphs in the images below: